views
Organizing Your Data

Familiarize yourself with your data to become more informed. Read the interviews to start getting to know your sources. Then read the data again, this time making notes of your impressions. Go through the data set several times, and determine which interviews are useful and which you might set aside. You'll read through the interviews multiple times. Each time, note any new thoughts you have or questions that you need to answer.

Transcribe the data to make it easier to work with. Make a neatly typed record of all of your data. If you took handwritten notes during the interviews, type them up. Also, transcribe any notes that you took while you were familiarizing yourself with the data. Creating an electronic version will help you easily search your data and reorganize as necessary. If you recorded the interviews, you'll need to transcribe the recordings, too. Transcription might seem tedious, but it's a great way to further immerse yourself in the data. You can also choose to use transcription software instead. You can use software to use fonts as indicators and also include features such as time stamps.

Consider your own bias. As you transcribe, you'll start to form opinions about your interviews. Take some time to reflect on what informs your views. You can still be objective, but it's important to think about your own perspective as you go through your data. Think about: Your social situation Your economic situation Your personal characteristics

Choose a clear focus for your data. Now that you understand your data set, you need to decide how you want to use it. Maybe you are working on a study of the public school system in Chicago. You might have interviewed a wide variety of people. You might need to decide which viewpoint to highlight in order to give your study a more clear focus. For example, you might want to use the interviews with teachers as your main focus. Alternatively, you might highlight the voices of parents.

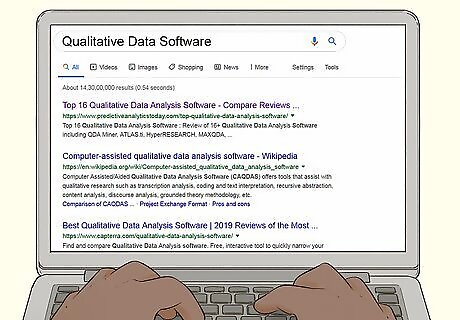
Consider using software to make your analysis faster. When you're ready to further sort the data, weigh the pros and cons of using software. Qualitative Data Software (QDA) can be really helpful for categorizing and coding. It can definitely make the process faster! Some pros of software include finding different methods of categorization, the ability to share your data with other researchers, and it also allows you to better manage large data sets. Before purchasing software, read online reviews of different products. Make sure that it will do what you need it to do. For instance, if you want it to transcribe your data set, make sure that it has a transcription function. You can also talk to co-workers, professors, or other researchers about which software they like to use. One drawback to using software is that you might not familiarize yourself with the data as much if you rely on software. It's really a personal choice.

Create a categorization system if you don't use software. You might try using different colored post-it notes, note-cards, or even different colored fonts in your typed notes. At first, you can try playing around with different systems so that you can see what feels comfortable to you. After you choose a system, create a key so that you remember what everything stands for. For example, you might note that red font indicates interviews with teachers.

Categorize the data. This process is also known as “coding” or “indexing” the data. It is simply the process of going through your data and sorting it into different categories. For example, in your interviews about the public school system, you could create a category of data and give it the code “classroom experience”. You could also give codes such as “elementary school” and “high school”. Your codes can be really simple! The idea is for them to be very user-friendly to you.
Using Thematic Analysis of the Interviews

Make connections in the data. As you work through the interviews, you'll begin to notice certain themes. For example, you might notice that teachers that work in one district are very focused on assessment. You can make that one of your themes. You might notice that parents of high school students are very focused on graduation rates. That might be another theme that you highlight.

Review the themes you found until you have a coherent set. Go back over your themes and look for any potential issues. For example, do some of your themes contradict each other? Do you need to more fully develop another set of themes? Keep arranging your data until you have a set of themes that support your argument. You want the interviews to satisfactorily answer your research question.

Describe your themes in an engaging way. This is when you want to start making your data accessible and interesting to others. Give the themes names that are descriptive and engaging to more fully develop your points. For example, instead of simply “assessment”, you might describe that theme as “innovations in measuring student success”.

Produce your report in a clear, informative manner. Once your themes are named, organize them in a coherent manner. For example, maybe you want to start with parent interviews and then move on to teacher experience. Another way to structure your report would be to assess something like the “cultural climate” in a school district and weave together parent, teacher, and student stories. If you are giving an oral presentation, make visual aids such as a PowerPoint presentation. This will help your audience engage with the material. It can be really useful to use video clips of the interviews. Just make sure you have secured the participant's permission!
Choosing Narrative Analysis

Gather a variety of sources related to your subject. You'll be weaving a story with narrative analysis. To make it more compelling, you'll rely on other sources in addition to your interviews. You can gather books, newspaper articles, blog posts, photographs, and anything else that relates to the research question that you're trying to answer. For example, you might go through the minutes of recent school board meetings. You could also look at photos of various classrooms around the city.

Read through your collection and note your responses. Immerse yourself in your interviews and other sources. Make notes about pieces that seem compelling, or spark other emotions. For example, maybe an interview with a teacher who works 3 jobs seems very interesting to you. Also make note if you think any of the sources aren't credible or if you think you need to verify the information elsewhere. Begin grouping related data to form stories. For example, group all of the material related to school counselors in one group. Ask yourself what type of story the data tells.

Analyze the content and context of each story. You might start by looking for content that is missing. For example, maybe none of the students talk about extracurricular activities. You might try to figure out why that is. You can also consider the context. For example, maybe those students are from a district with a high poverty rate. That could explain why extracurriculars seem out of grasp. Do any necessary additional resource. For example, you might want to conduct some follow-up interviews.

Create a story by combining the data. Group interviews and other sources together to create a compelling story. Rather than creating a traditional report, you will write a narrative. Typically, instead of including a lot of hard data, you'll focus on the more personal aspects of the interview. For example, your story might center on students who struggled to make the transition to high school and what sort of challenges they faced.


Comments
0 comment