
At least 78.7% Muslim women want the legal age for marriage for men and women to be 21 years, India’s biggest Uniform Civil Code (UCC) survey conducted by the News18 Network has found.
Without mentioning the UCC, 884 News18 reporters interviewed 8,035 Muslim women across 25 states and Union Territories in the country on themes the UCC is likely to cover. The survey participants were Muslim women in the 18-65+ category across regions, communities, educational and marital status, and across the educational spectrum, from the illiterate to the post-graduate.
The UCC, in effect, means one law which would be applicable to all religious communities in matters such as marriage, divorce, inheritance, adoption, maintenance, among others. Muslim organisations reacted strongly to the Centre’s recent announcement that the Law Commission would hold UCC consultations afresh, with the All India Muslim Personal Law Board (AIMPLB) saying the “majoritarian morality” should not override religious freedom and rights of minority communities in the name of a code. News18 Network decided to check if its views are indeed shared by the wider community, especially women, who would be most affected if the status quo were to continue.
MARRIAGEABLE AGE: 82% GRADUATES IN FAVOUR
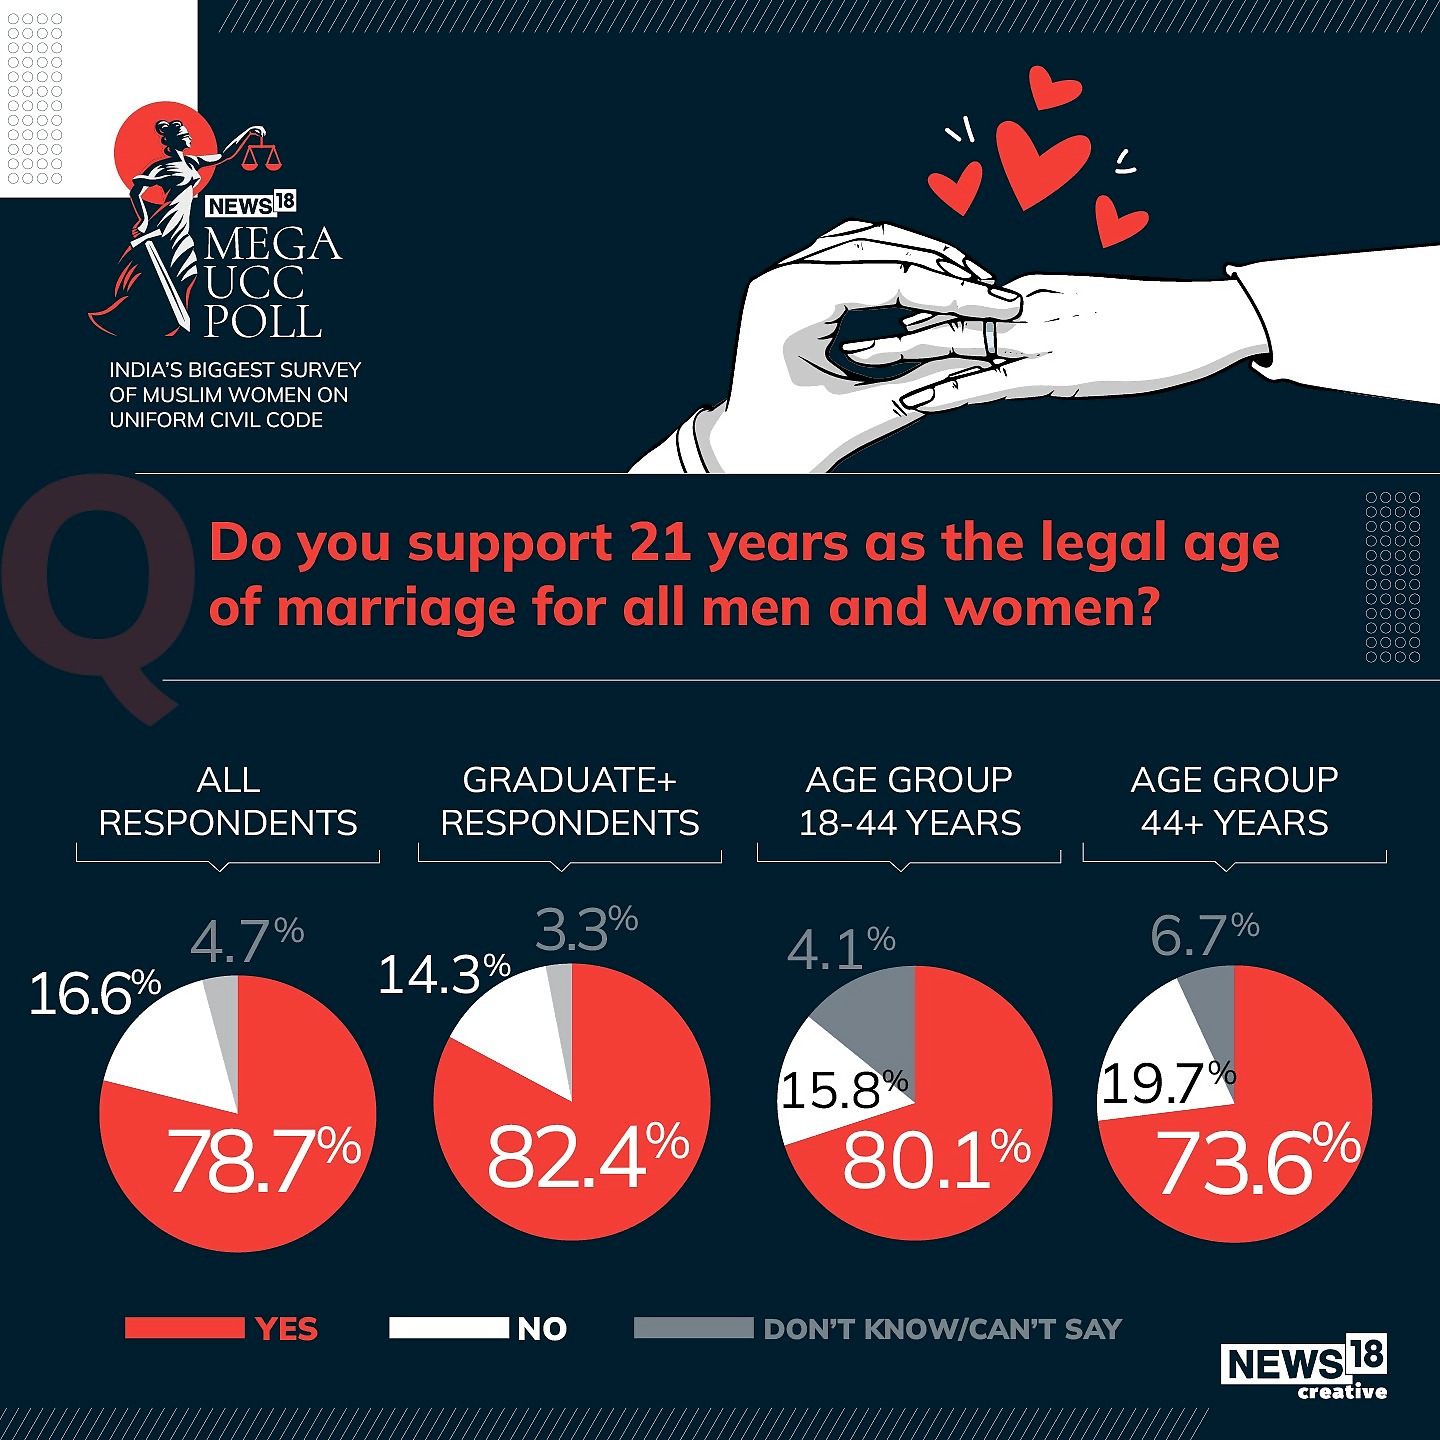
When asked if they support 21 years as the legal age of marriage for all men and women, 78.7% (6,320) women said ‘yes’, 16.6% (1,337) said ‘no’, while 4.7% (378) said ‘don’t know or can’t say’.
Among the respondents who had completed their graduation and more, 82.4% (2,500) said ‘yes’, 14.3% (433) said ‘no’, while 3.3% (100) said ‘don’t know or can’t say’.
#UniformCivilCode: 78.7% of Muslim women think that 21 years should be the legal age of marriage for all men and women, reveals News18's #MegaUCCPoll@AnchorAnandN and @Zakka_Jacob decode the findings;"Let's make it (UCC) about gender justice and equality and not really about… pic.twitter.com/oIbkiJVasM
— News18 (@CNNnews18) July 10, 2023
In the 18-44 age group, 80.1% (5,040) said ‘yes’, 15.8% (995) said ‘no’, and 4.1% (260) said ‘don’t know or can’t say’. In case of those aged 44+, 73.6% (1,280) said ‘yes’, 19.7% (342) said ‘no’, and 6.7% (118) said ‘don’t know or can’t say’.
Of the surveyed women, 18.8% were in the 18-24 age group, 32.9% were aged 25-34, 26.6% were aged 35-44, 14.4% were aged 45-54, 5.4% were aged 55-64 and 1.9% were 65+. While 70.3% were married, 24.1% were unmarried, 2.9% were widowed and 2.9% divorced. A total of 73.1% of the respondents were Sunni, 13.3% Shia and 13.6% others.
Among the women surveyed, 10.8% were post-graduates, 27% graduates, 20.8% had studied up to Class 12+, 13.8% were Class 10+, 12.9% had studied till Class 5-10, 4.4% up to Class 5, 4.2% were illiterate and 4.2% had basic literacy, with 1.9% others.


Comments
0 comment