views
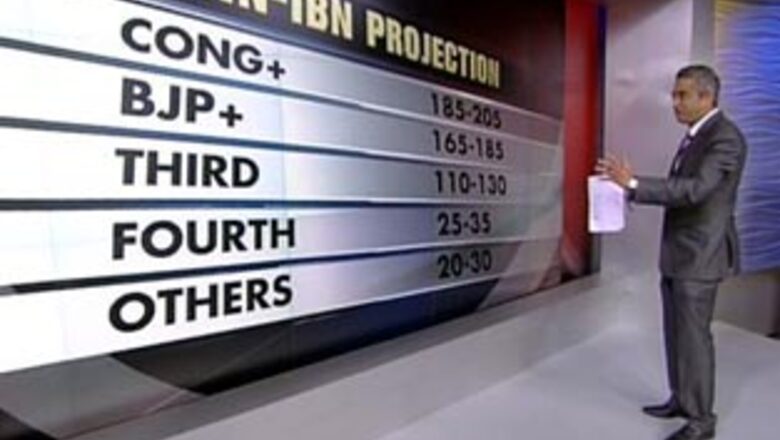
New Delhi: A post-poll analysis conducted by CNN-IBN in association with the Centre for Study of Developing Societies shows the Congress-led UPA is projected to have a slight edge over NDA and others in the Lok Sabha elections.
According to the study, Congress+ is likely to get anywhere between 185 and 205 seats, BJP+ is projected to get a close figure of anywhere between 165 and 185 seats.
The Third Front – likely to play the kingmakers if it doesn’t disintegrate – is likely to get 110 to 130 seats and the Fourth Front likely to get 25 to 35 seats. Others could get between 20 and 30 seats
THE BIG PROJECTION
- Cong+: 185 to 205 seats
- BJP+: 165 to 185 seats
- Third Front: 110 to 130 seats
- Fourth Front: 25 to 35 seats
- Others: 20 to 30 seats
UPA’S ROUTES TO POWER
OPTION 1:
- Cong and its allies get close to 200 seats
- RJD, LJP and SP add about 40 seats
- The Left with 35 seats gives outside support
- UPA+ crosses majority mark
- Likelihood: Possible
OPTION 2:
- UPA gets 180 to 200 seats
- SP gets 25 seats
- Nitish Kumar & Jayalalithaa switch sides
- Smaller parties like BJD, PMK also join in
- UPA+ crosses majority mark
- Verdict: Possible
NDA’s ROUTES TO POWER
OPTION 1:
- NDA gets close to 200 seats
- Ex-NDA partners AIADMK & TDP return with about 50 seats
- Mayawati supports with about 35 MPs
- NDA crosses majority mark
- Likelihood: Possible
THIRD FRONT’S ROUTE TO POWER
OPTION 1:
- Third Front gets about 140 seats
- Gets Fourth Front support
- Gets other UPA allies to support it
- Or gets UPA to lend outside support
- Likelihood: Unlikely
NEXT PAGE: STATE-WISE BREAKUP
PAGE_BREAK
ASSAM
Notes: These estimates and other data here are based on a post-poll survey of 1,402 respondents carried out in the state as a part of the National Election Study. The voting preference reported by the respondents has been adjusted to conform to the known demographic profile of the state and to account for past patterns of under or over reporting. In the last election the AGP and the BJP contested separately. The Vote change in this context is calculated by merging the individual vote for the two parties for 2004; AUDF did not exist in 2004. Estimated Vote Shares are in percent, while Swings are in percentage points.
BIHAR
Note: All figures in percent.
CHHATTISGARH
Note: The voting preference reported by the respondents has been adjusted to conform to the known demographic profile of the state and to account for past patterns of under or over reporting.
PAGE_BREAK
KARNATAKA
Note: These estimates and other data here are based on a post-poll survey of 2,127 respondents carried out in the state as a part of the National Election Study. The voting preference reported by the respondents has been adjusted to conform to the known demographic profile of the state and to account for past patterns of under or over reporting.
KERALA
Note: These estimates and other data here are based on a post-poll survey of 811 respondents carried out in the state as a part of the National Election Study. The voting preference reported by the respondents has been adjusted to conform to the known demographic profile of the state and to account for past patterns of under or over reporting. The comparison of the BJP is with BJP and its ally in 2004.
MAHARASHTRA
Note:These estimates and other data here are based on a post-poll survey of 2,459 respondents carried out in the state as a part of the National Election Study. The voting preference reported by the respondents has been adjusted to conform to the known demographic profile of the state and to account for past patterns of under or over reporting. Estimated Vote Shares are in percent, while Swings are in percentage points.
PAGE_BREAK
ORISSA
Note:All figures in percent. Note: These estimates and other data here are based on a post-poll survey of 1,152 respondents carried out in the state as a part of the National Election Study 2009. The voting preference reported by the respondents has been adjusted to conform to the known demographic profile of the state and to account for past patterns of under or over reporting. NOTE: The BJP and the BJD were together in the 2004 Elections
Note: All figures in percent.
ANDHRA PRADESH
Note: All figures in percent.
Note: All figures in percent.


Comments
0 comment